- Обучение
- Графический анализ
- Фигуры продолжения тренда
Trend Continuation Patterns
The trend continuation pattern is the price model indicating the tendency will continue after the current situation. While the model forming the price moves in a narrow range. There are several trend continuation patterns. Let's discuss them and their indicators.
The flag formation is a rectangle sloping downward or upward and having a long pole. It forms during a pause after a strong movement.
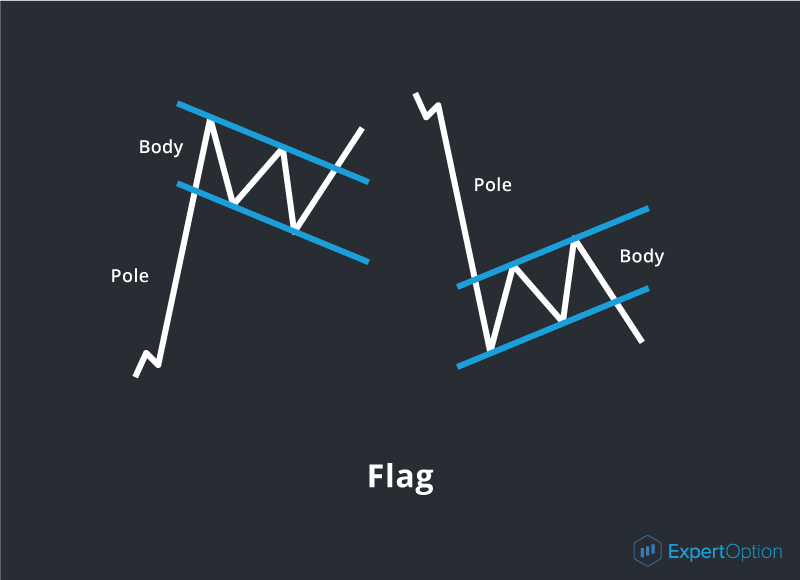
The flag consists of its body and pole. The pole height indicates a target price after the end of the price formation. Usually, the flag body includes 5 waves and price breaks out of the flag formation on the fifth wave.
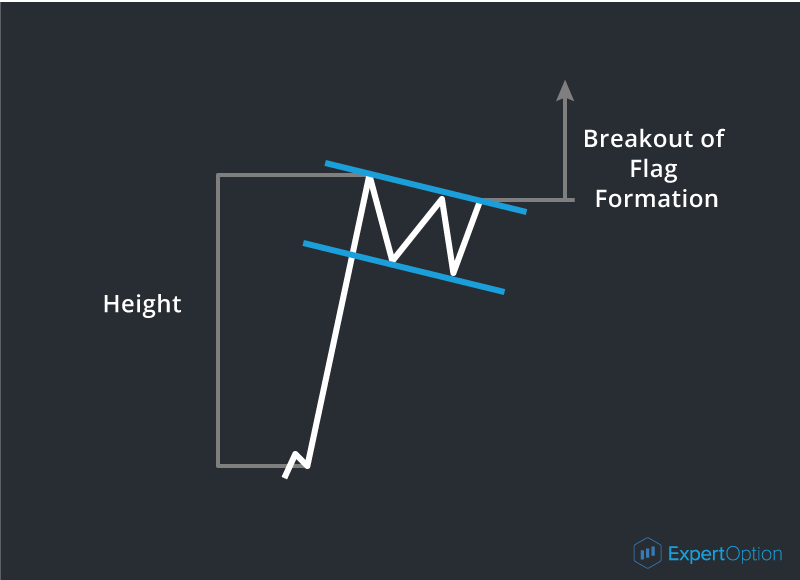
The strength of the formation depends on the angle of the formation slope against the main price movement. The more the flag body is directed downwards — the stronger the continuation pattern is. It's better to trade online after a breakout of the price formation.
The pennant formation looks very much like a flag with a triangular body shape. The difference between the pennant and flag formations is that the pennant has a small movement in a narrow range. On the chart, it looks like a small triangle on a long pole (candle).
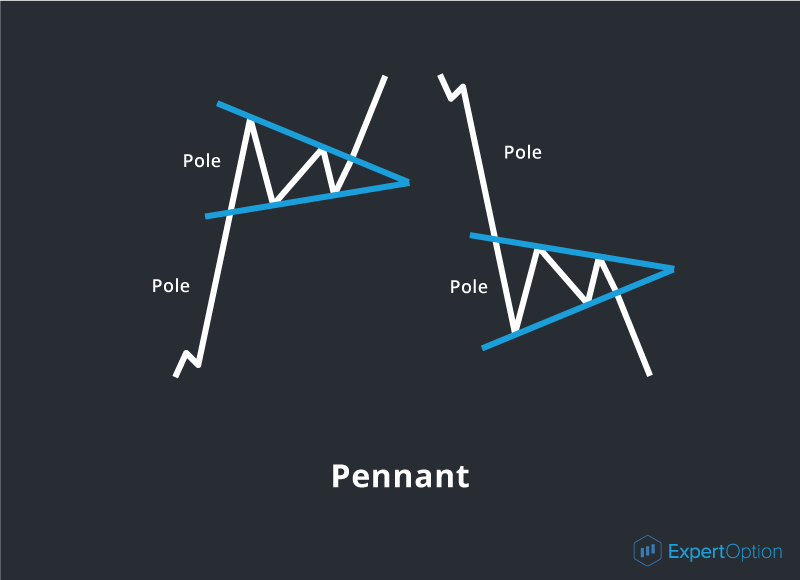
The pennant also consists of a body and pole. A pole height indicates a target price after the breakout of the pennant formation. That means that after the breakout of formation, the price will move the distance equal to the pole height. The small pennant body also consists of 5 waves.

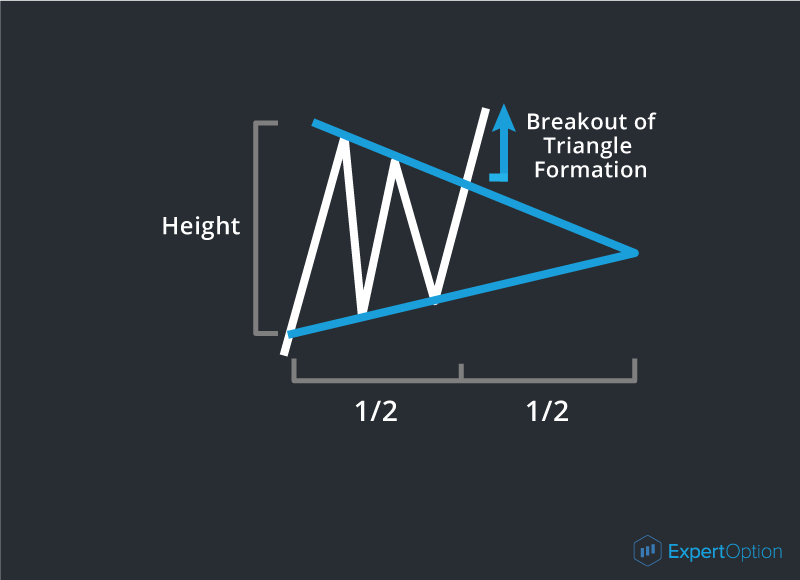
The other continuation pattern is a triangle formation. It's a dying price movement during a pause in the market. On the chart, it looks like a usual triangle. Depending on its direction to the tendency, it can give a strong or weak continuation pattern.
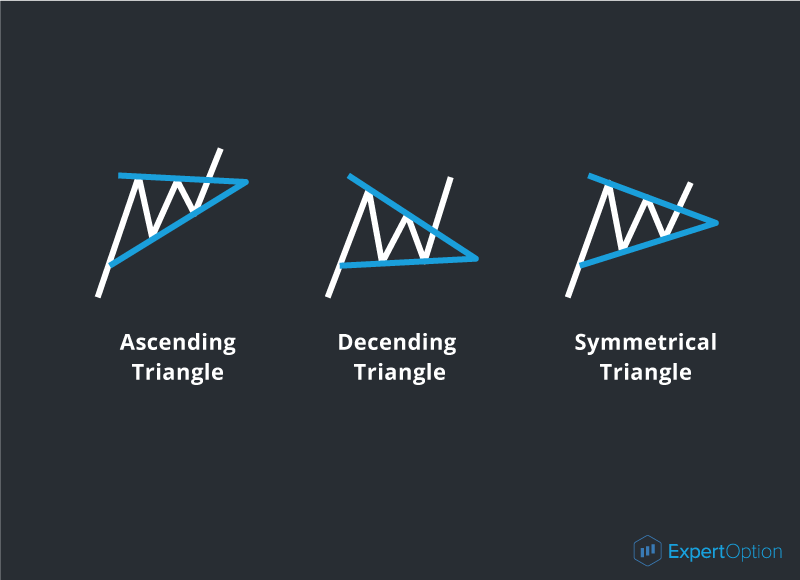
A symmetrical triangle at any moment of trend is always a strong continuation formation. But if an ascending triangle appears on the bearish trend and a descending triangle appears on the bullish trend there will be a weak continuation pattern that requires confirmation. The ascending triangle on the bullish trend or the descending triangle on the bearish trend indicates a strong continuation pattern. The triangle is formed on the same principles as the mentioned formations and gives the same results:
• A classic triangle has 5 waves, but if it has more waves the movement can be stronger after the breakout of the triangle formation.
• The price breaks out of formation in the first half or three-quarters of the triangle, but if it breaks out in its last quarter the price movement will be short and weak.
• After the formation breakout the price will cover the distance equal to the widest part of the triangle formation.
When the triangle formation appears on the chart it's a good opportunity to trade online after the breakout of this price model.
The tendency continuation patterns are not only good trading cues but also help to estimate a target price. If you know the possible distance of the price movement you can trade during this period with confidence. We would also like to highlight that the formation searching is not a science. Traders should decide for themselves if they see the formation or something like that. The more you work with the technical analysis patterns the easier you can find them and trade successfully. But while you have no experience you should remember the rule: if you see and understand the price chart formation clearly it will surely work.