- Обучение
- Графический анализ
- Графический анализ
Graphical Analysis
When we work in the market, we always ask the same question — where will the price move? A chart analysis is one of the methods to answer this question. The chart analysis is a study of price patterns on the chart. If you remember them, you'll be able to foresee the future price movement. When you see the price pattern you saw before, you'll likely be able to suggest where it will end.
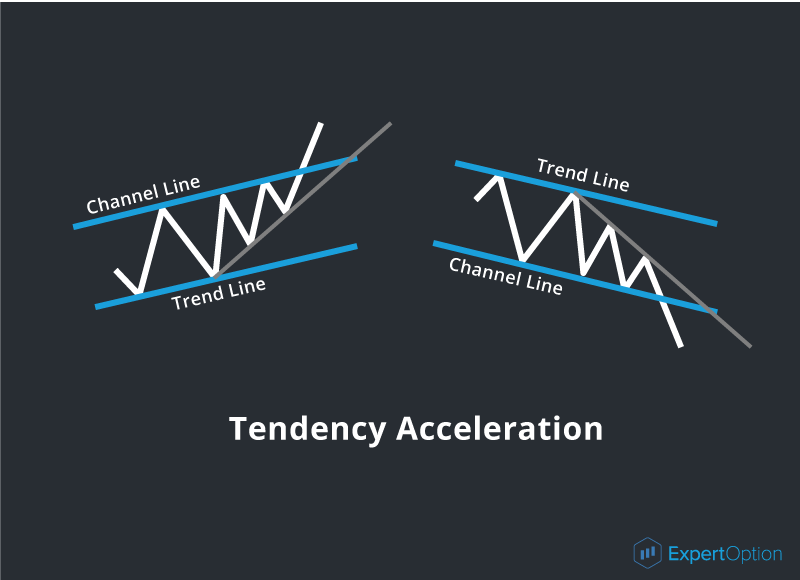
As we know, the price history repeats and tells us about the different price patterns, the results of which can be foreseen and used. Let's use the price movement in the trend channel as an example. The price moves in the trend channel following the definite formation and gives us the cues of the tendency acceleration, deceleration, and reversal. Let's consider each variant in detail:
1) The tendency acceleration is the situation when the price chart is not able to return to a trend line approaching a channel line closer and closer. It breaks the line forming a new tendency with the same direction. You can see the example below:
2) The tendency reversal is the situation when the price chart cannot return to a trend line, approaching a channel line closer and closer, and it breaks the line forming a new reversal tendency. It looks as follows:
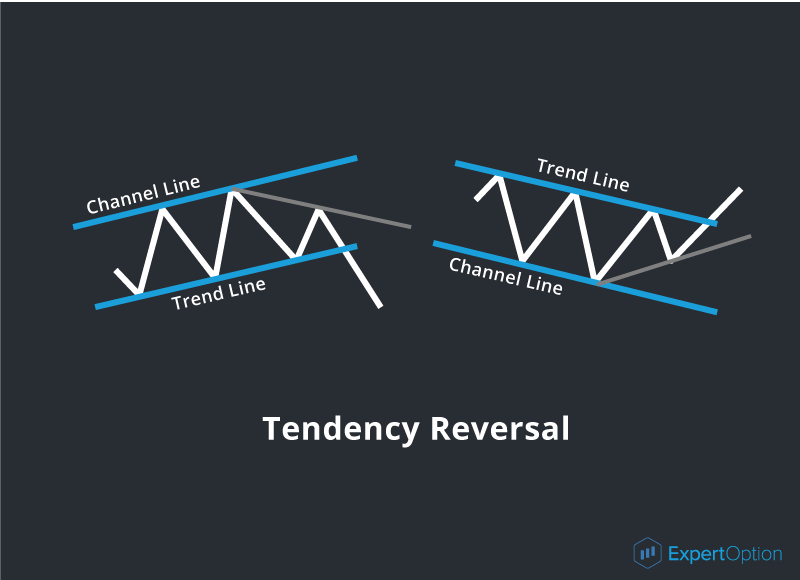
If you work with the trend channel, you can get the information to estimate the tendency changes and trade successfully. Working with the trend direction is the most effective way and reduces the risks to a minimum.
Except for the cues in the trend channel, you can also use the different technical analysis patterns. The technical analysis patterns are the price chart patterns with their definite regularities which help us to learn where the price will go after the model formation. These patterns appear when the tendency is forming and can advise the price direction to trade. There are two types of such patterns:
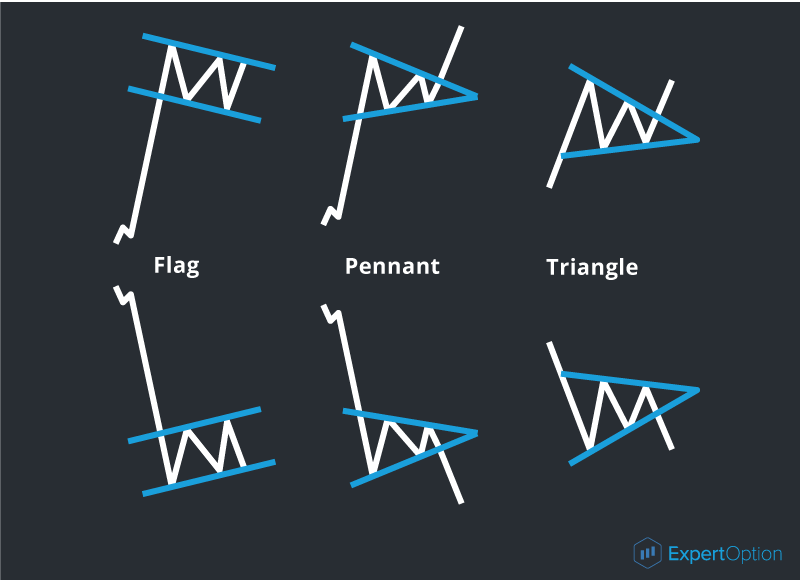
1) The tendency continuation pattern indicates the current price movement hasn't stopped yet but will continue after a pause. The continuation formations are a triangle, a pennant, and a flag.
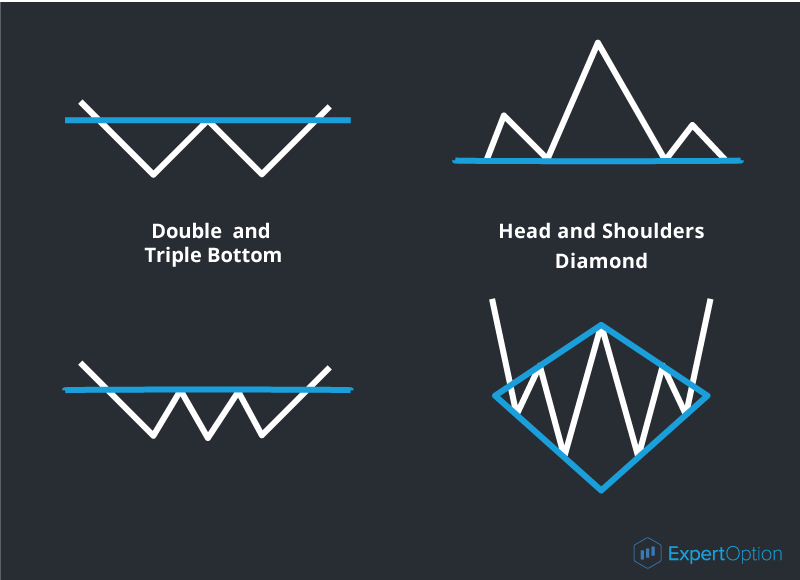
2) The reversal pattern is the price movement which indicates a current tendency is ending and a new tendency will be formed. The reversal formations are double and triple bottoms, head and shoulders, and a diamond.
The reversal patterns can give the cues during and after the tendency. An important advantage of the technical analysis patterns is an opportunity to calculate the potential movement and use these results for online trading. We will consider each model in our following articles.